There are many software tools that we could use to perform analytics on business data. They will enable us to make decisions easier with greater insights. Some of the tools do well for descriptive analytics, while some other are good to facilitate predictive or prescriptive analytics (as I have mentioned in my previous posting ‘Analytics for businesses‘).
Here I provide 10 of the software tools that you could use for business analytics. My listing is not based on any preferences or recommendations.
All-new Kindle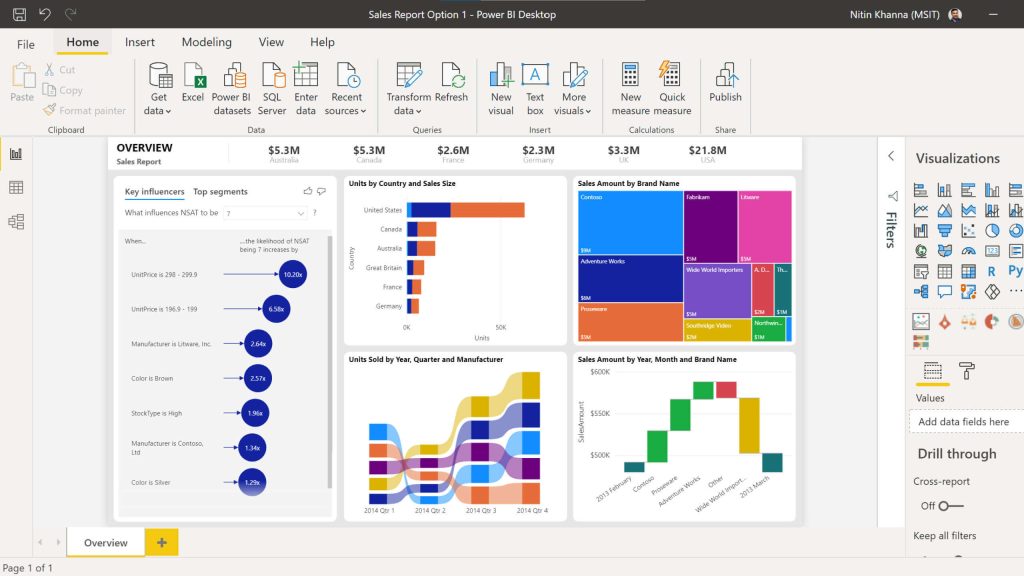
Microsoft Power BI is a unified and scalable platform for self-service and also enterprise business intelligence (BI). The software connects to and visualises any data, and seamlessly infuse the visuals into many user applications. Gartner recognized Microsoft as a Magic Quadrant Leader in analytics and business intelligence platforms
Computers and Peripherals for you
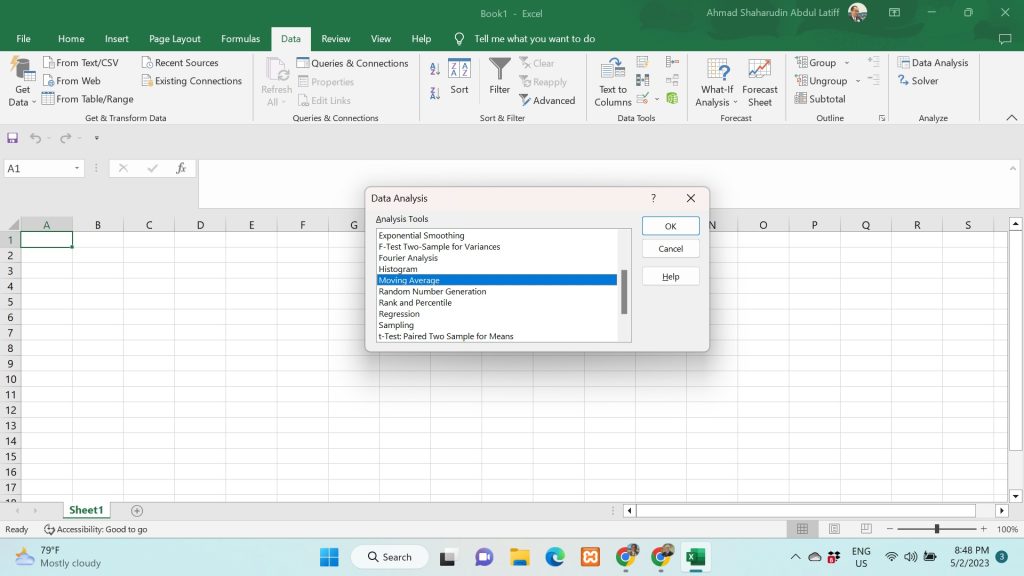
You can also develop complex statistical or engineering analyses using Excel Analysis ToolPak. You provide the data and parameters for each analysis, and the Analysis Toolpak will use the appropriate statistical or engineering macro functions to calculate and display the results in an output table. The data analysis functions can be used on only one worksheet at a time.
Computers and Peripherals for you
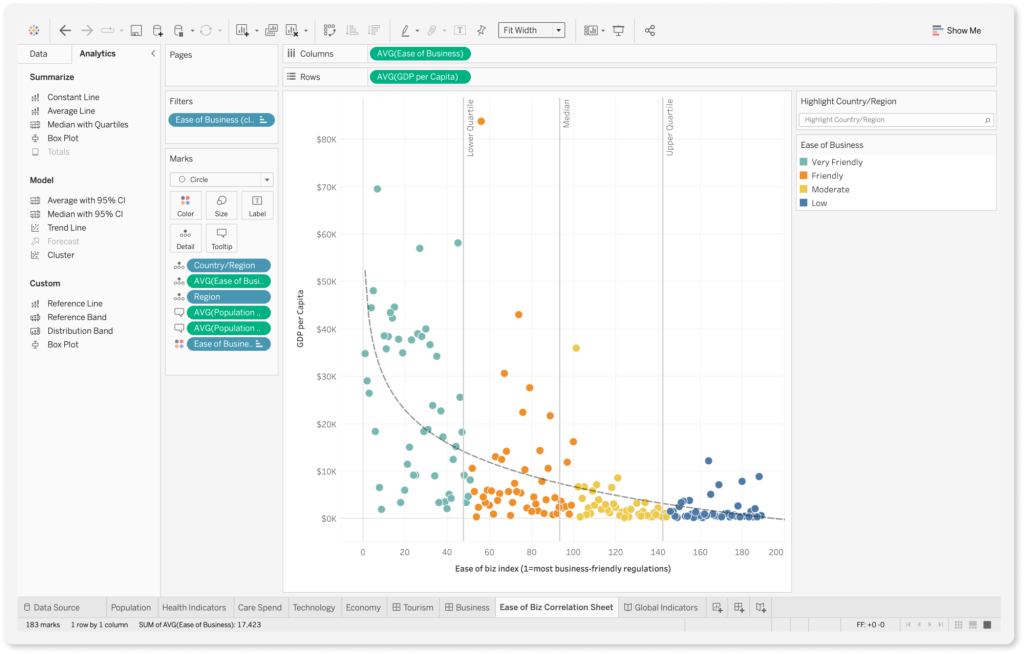
Tableau is an interactive data visualisation software company that is focused on business intelligence. helps users to visualise their data. Tableau products query relational databases, online analytical processing cubes, cloud databases, and spreadsheets to generate graph-type data visualizations. It provides remarkable visualisation capabilities and easy to use. It could establish connections with many data sources such as Hadoop and SAP. The performance is robust and reliable. Yet, it is pricey, although not as expensive as Oracle’s or IBM’s solutions. Tableau lacks functionality needed for large-scale reporting like those of a full-fledged business intelligence tool.
Computers and Peripherals for you
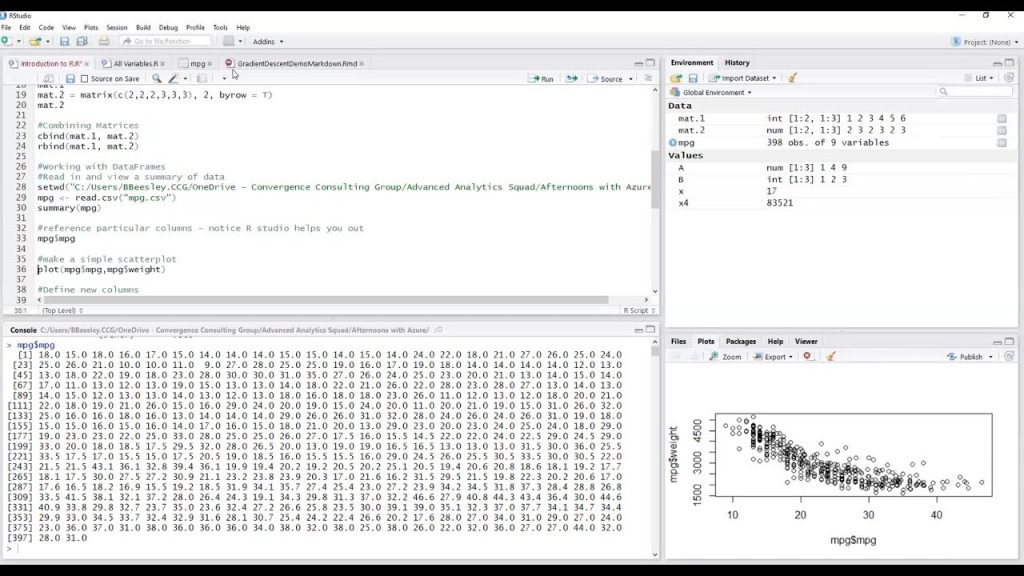
R is a language and environment for statistical computing and graphics. It was started by professors Ross Ihaka and Robert Gentleman as a programming language to teach introductory statistics. R can be considered as a different implementation of the S programming language. In turn, S is a statistical programming language developed primarily by John Chambers, Rick Becker and Allan Wilks of the Bell Laboratories. R provides a wide variety of statistical and graphical techniques, and is highly extensible. While, S language is often be the vehicle of choice for research in statistical methodology; R provides an Open Source route to participation in that activity.
Computers and Peripherals for you
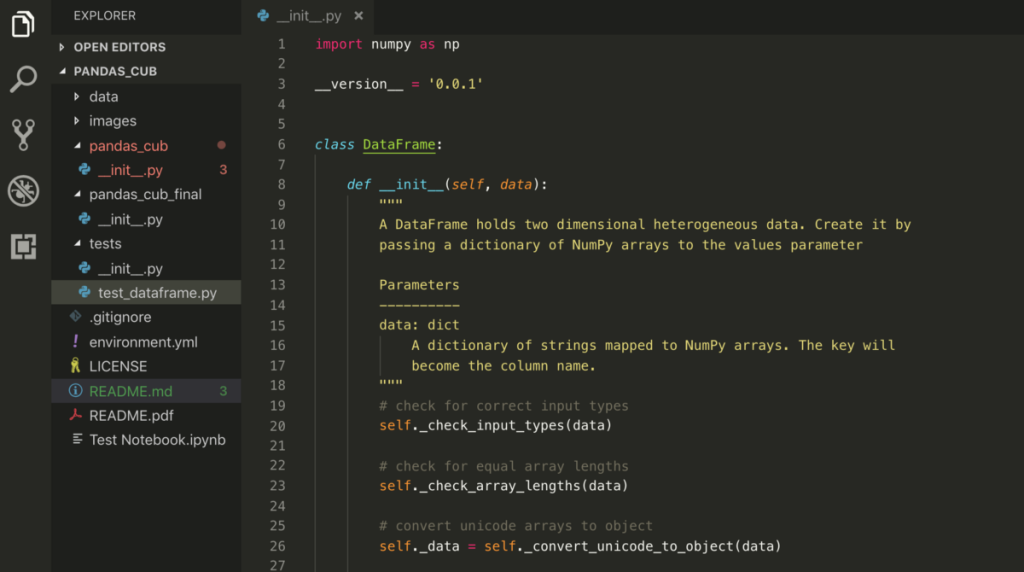
Python is a high level general purpose programming language with emphasis of code readability. It is easy to use, fast, and manipulates data seamlessly. As such, it is one of the best programming languages widely used in data analytics. It supports various data analytics activities such as data collection, analysis, modelling, and visualisation.
Computers and Peripherals for you
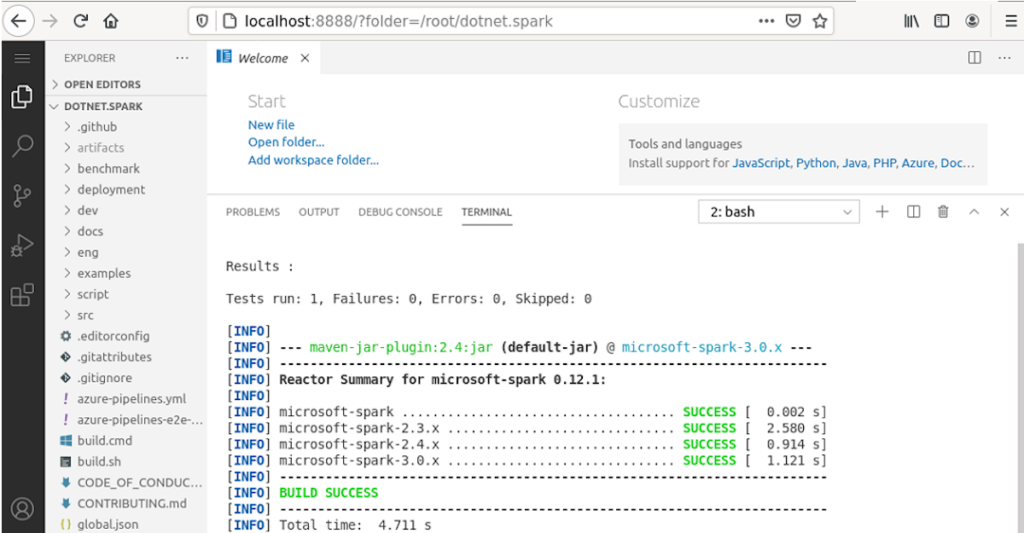
Apache Spark is an open-source unified analytics engine for large-scale data processing. It provides an interface for programming clusters with implicit data parallelism and fault tolerance. It is a multi-language engine for executing data engineering, data science, and machine learning on single-node machines or clusters. It can unify the processing of your data in batches and real-time streaming, using your preferred languages; i.e., Python, SQL, Scala, Java or R. It is able to execute fast distributed ANSI SQL queries for dashboarding and ad-hoc reporting. It can perform Exploratory Data Analysis (EDA) on petabyte-scale data without having to resort to down-sampling and train machine learning algorithms.
Computers and Peripherals for you
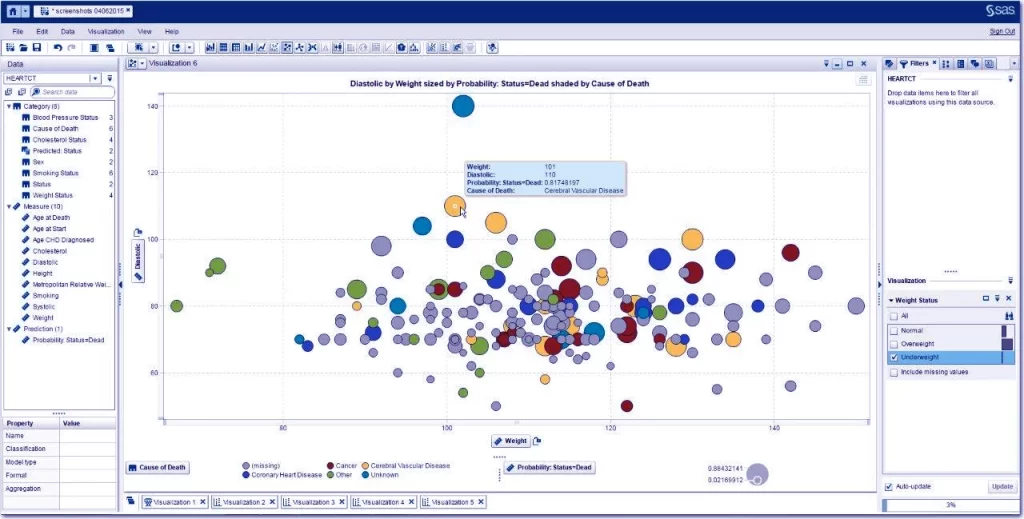
The Statistical Analysis System (SAS) began as a project at North Carolina State University’s agricultural department. Now known as SAS Institute, it develops, supports and markets a suite of analytics software also called SAS (statistical analysis system), which captures, stores, modifies, analyzes and presents data. SAS is a command-driven software package used for statistical analysis and data visualization. It is available only for Windows operating systems is a widely used statistical software packages in both industry and academia. The SAS language is a computer programming language used for statistical analysis that can read in data from common spreadsheets and databases and output the results of statistical analyses in tables, graphs, and as RTF, HTML and PDF documents. The main purpose of SAS is to retrieve, report and analyze statistical data. SAS is quite a popular data analytics software that data analysts and data scientists use to analyze data by manipulating database tables and performing various data operations. SAS Software has been applied these last decades to almost any kind of business problem in every industry. There are no limits given the large choice of analytics techniques provided by SAS from descriptive to predictive and prescriptive analytics.
Computers and Peripherals for you
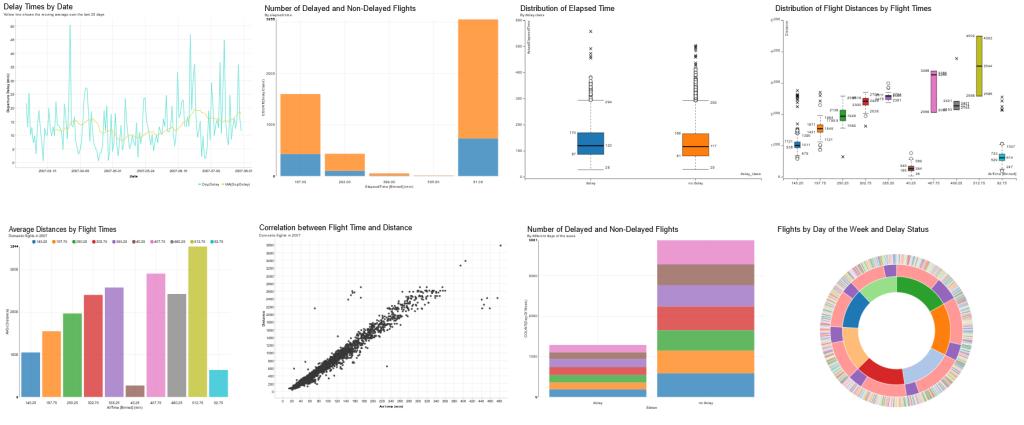
KNIME, the shortform of Konstanz Information Miner is a free and open-source data analytics, reporting and integration platform. KNIME integrates various components for machine learning and data mining through its modular data pipelining “Building Blocks of Analytics” concept. A graphical user interface and use of JDBC allows assembly of nodes blending different data sources, including preprocessing (ETL: Extraction, Transformation, Loading), for modeling, data analysis and visualization without, or with only minimal, programming.
Computers and Peripherals for you
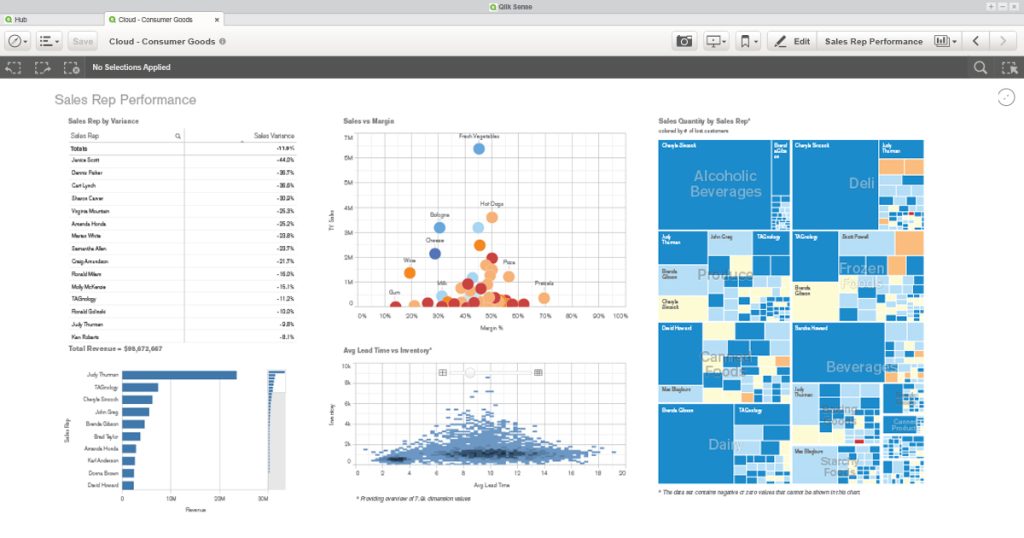
Qlik Sense is a complete data analytics solution that allows users to create visualizations, charts, interactive dashboards and analytics apps for local and offline usage. Its associative analytics engine. artificial intelligence, and high performance cloud platform can empower everyone to make better decisions daily and take action creating a truly data-driven enterprise. Its data integration and analytics enable users to easily uncover insights, take timely action and go beyond passive BI and dashboards. It could quickly combine data towards creating rich, interactive visual analytics in a secure cloud to operationalize analytics across groups and teams environment. Qlik Sense a data visualization and discovery product that allows you to create flexible, interactive visualizations that lead to meaningful decisions supporting a full spectrum of analytics use cases on a multi-cloud platform. Qlik Sense is a very suitable analytics platform for SMB companies who have several business units or many different data sources
Computers and Peripherals for you
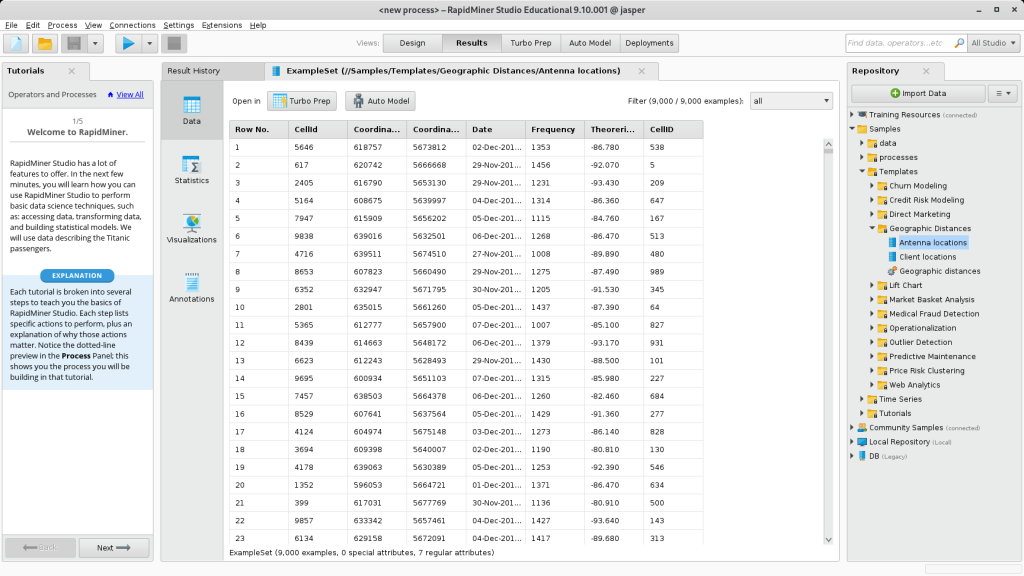
RapidMiner is a platform that has been designed to support many analytics users across a broad AI lifecycle. provides data mining and machine learning procedures including: data loading and transformation (ETL), data preprocessing and visualization, predictive analytics and statistical modeling, evaluation, and deployment. RapidMiner is a powerful data mining tool that enables everything from data mining to model deployment, and model operations. Their end-to-end data science platform offers all of the data preparation and machine learning capabilities. The program includes data science and visualization tools. It has a graphical user interface tool that allows you to link elements on a palette to do design, perform data analysis and execute analytical workflows.
All-new Kindle
This is great indeed Prof. Highly interesting and educative.
Thank you, Dr. Danjuma